There are two kinds of visual accessibility that play an important role in vision-impairment patients, accessibility of a space and of electronic devices (especially smartphones). On one hand, the use of smartphones in the blind and low vision community in Australia has increased significantly: by 365% in the last five years[1]. On the other hand, almost every daily activity is threatened by potential environmental hazards, such as low-contrast borders, glaring reflection and so on, leading to falling and distortion.
However, even those within the same disability ‘category’ (for example, low vision vs blind) can experience devices very differently. A more nuanced understanding of disability within design teams would assist developers in accounting for the full range of uses of their device, app, interface, or software. After all, the better developers understand their users, the better they can provide what those users actually need.
Visual Accessibility of Spaces
The visual accessibility of a space refers to the effectiveness with which vision can be used to travel safely and pursue intended activities in the space. Visual accessibility of a space reduces significantly for impaired vision, leading to higher risks of encountering hazardous situations, falling, and being disoriented in navigation. It is possible to improve environmental accessibility by enhancing the visibility of informative or hazardous features through cost-effective modifications of contrast, illumination, and materials. However, it is difficult for people with normal vision, even those with rehab expertise, to judge whether specific objects or features would be visible for individuals with different levels of vision impairment, or to examine the efficacy of modifications.
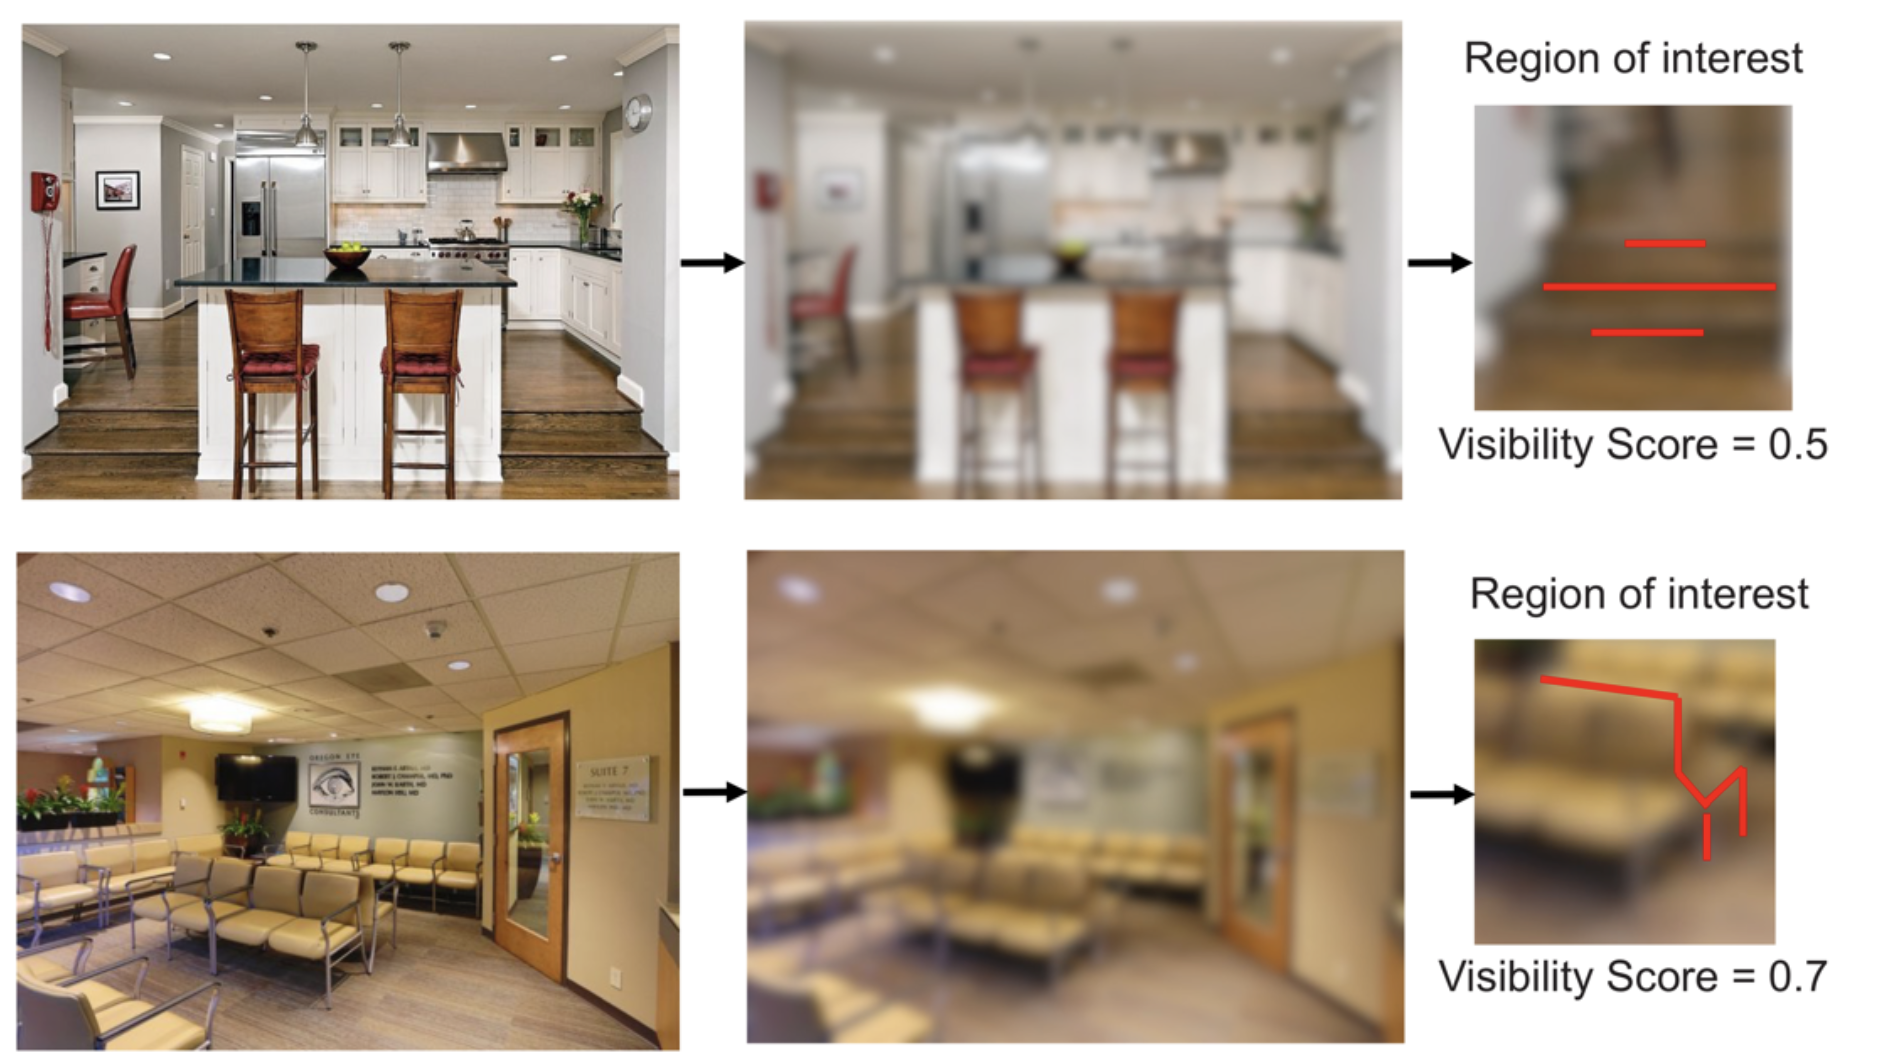
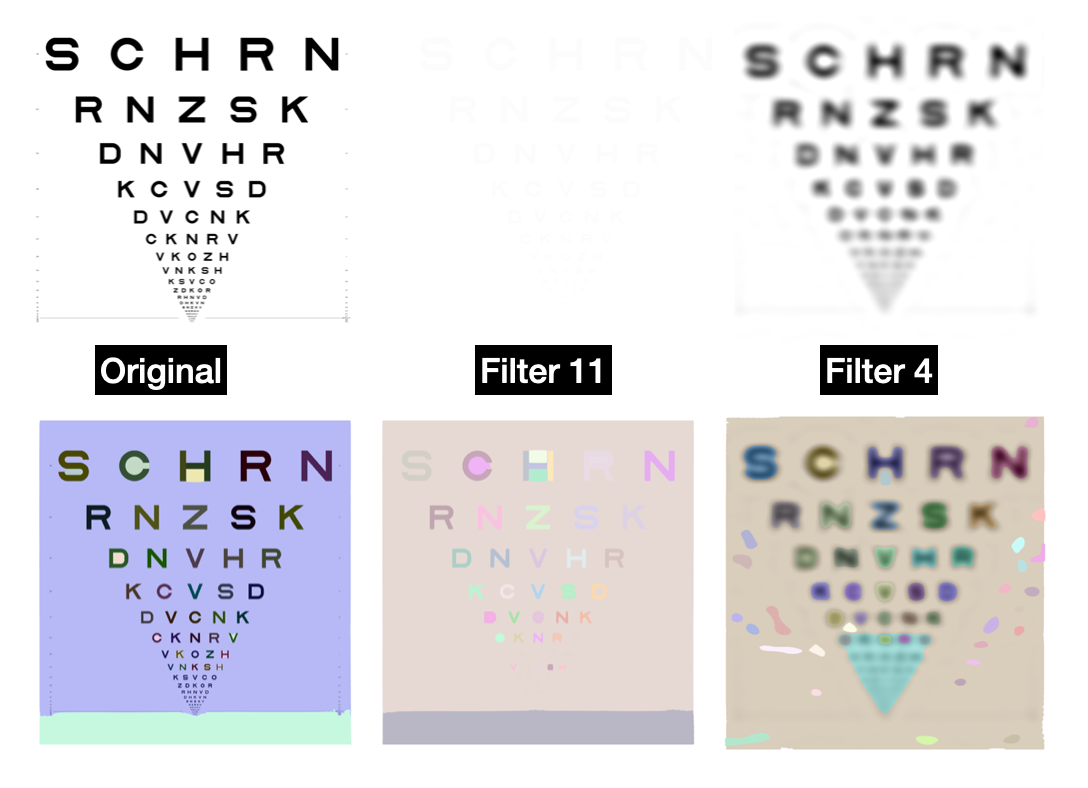
Now we could design bio-inspired low-vision filters to simulate what low-vision patients see, but there are still challenges to evaluating the gap between simulated images and reduced images seen by patients, due to
- the limit of technology to detect and display images perceived in the brain directly.
- the difficulty for vision-impairment patients to annotate ground truth data because of the glare and other parameters of the screen
- the black-box property of deep learning models makes it hard to explain both the model itself and to evaluate the output and ground truth(mAP would not be sufficient enough to validate models’ usability, we need a specific metric instead)
XAI and Accessibility
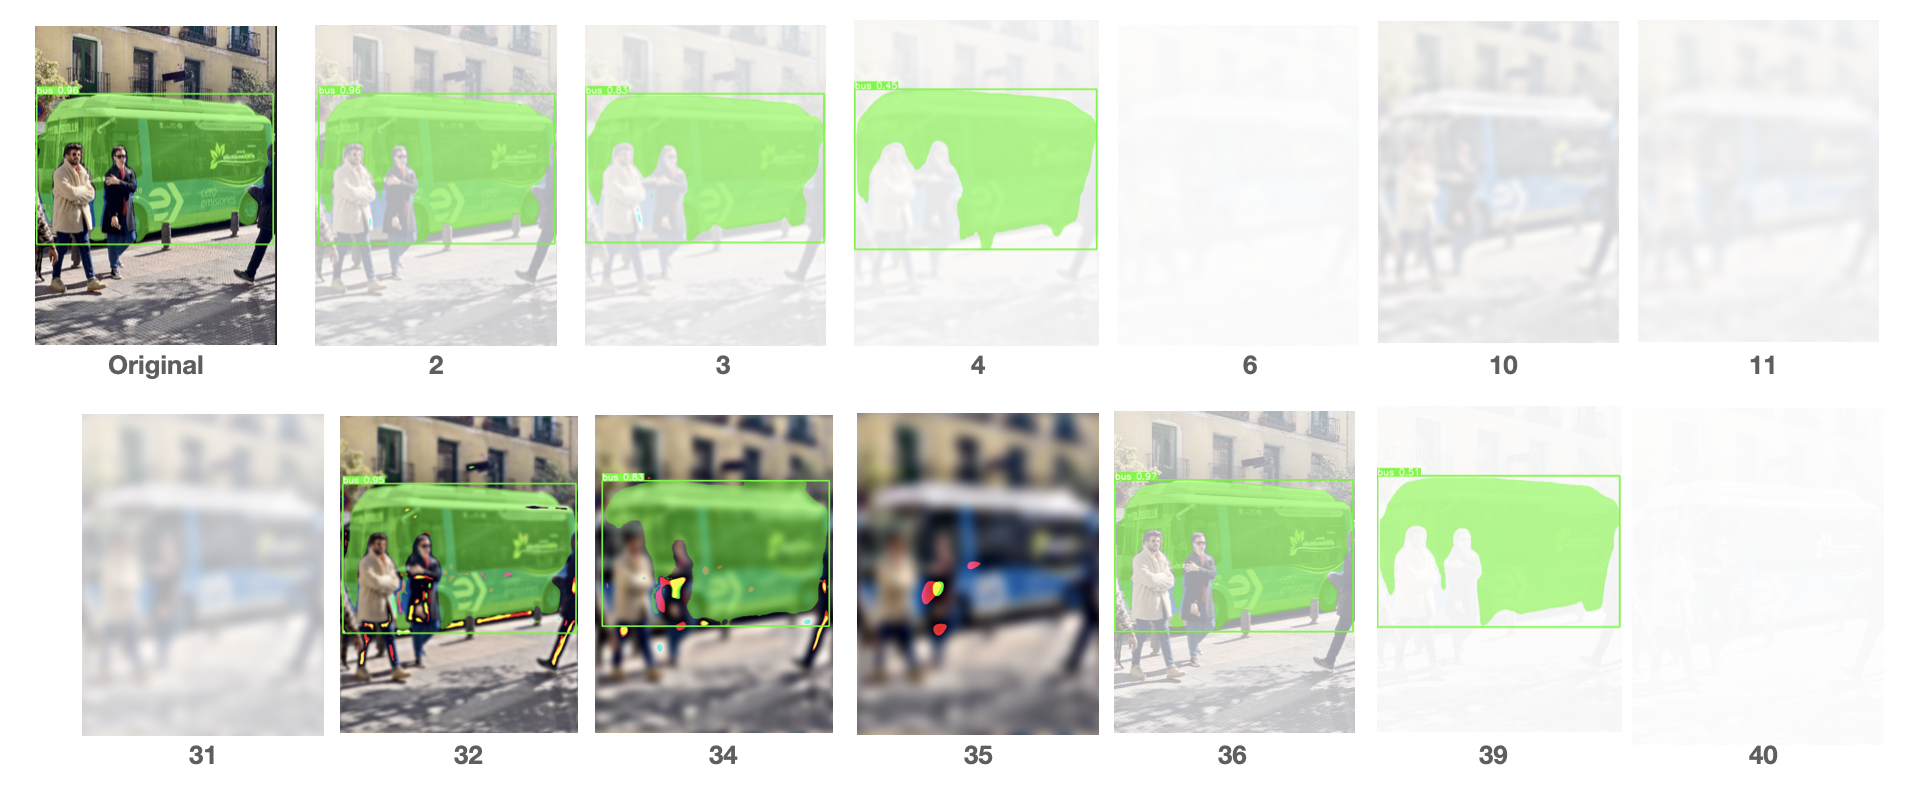
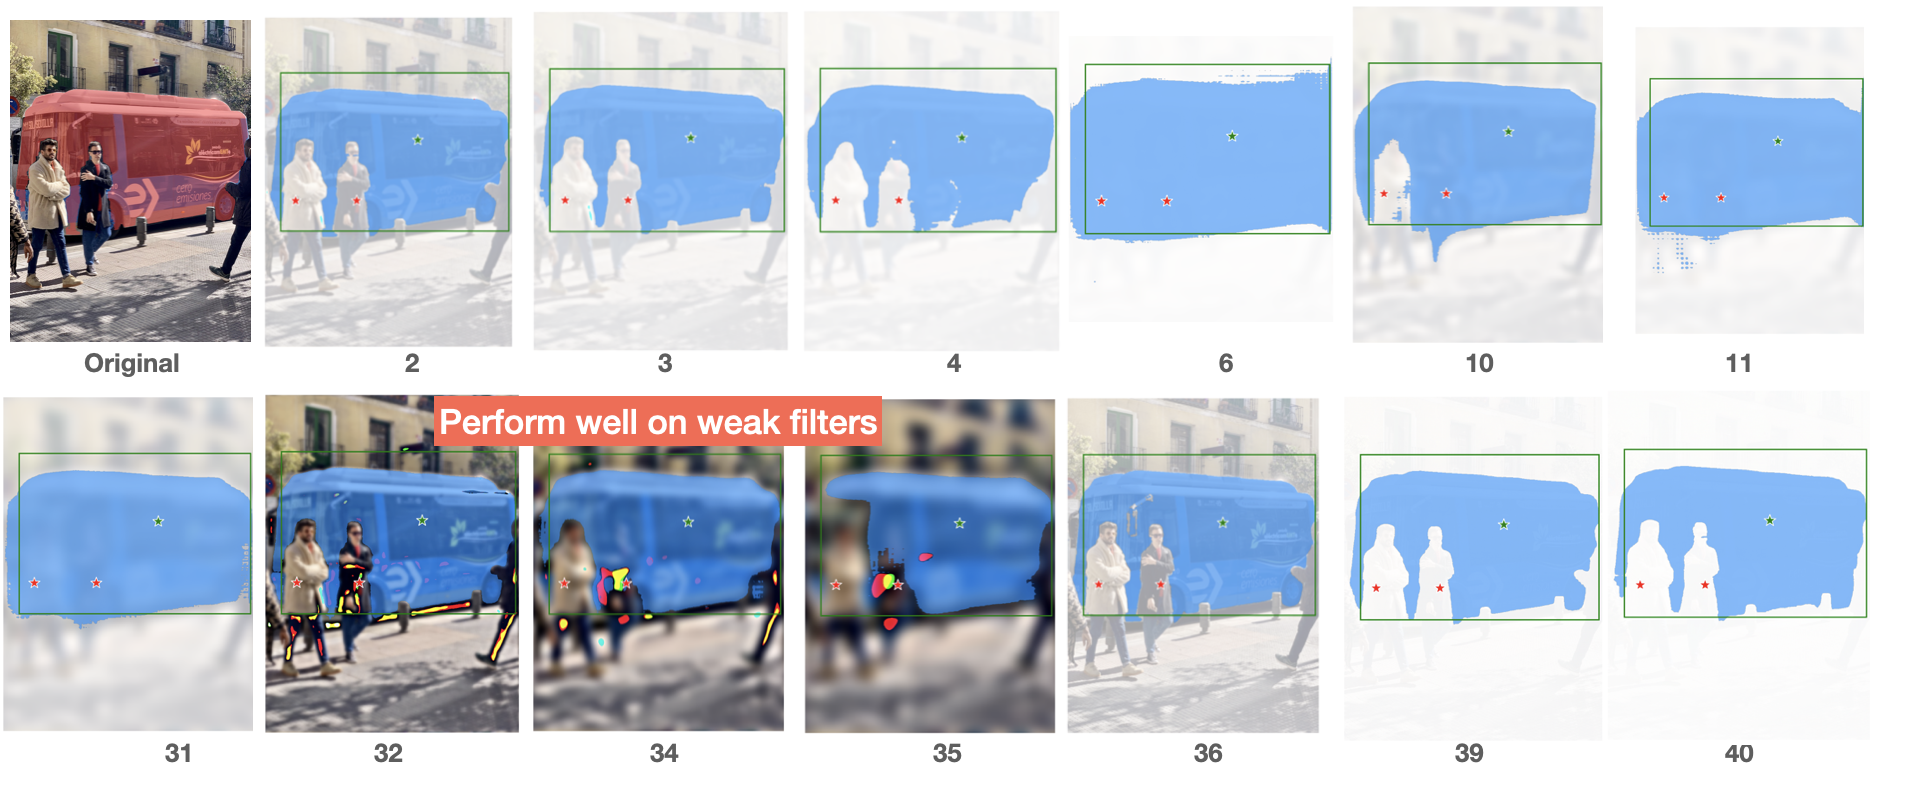
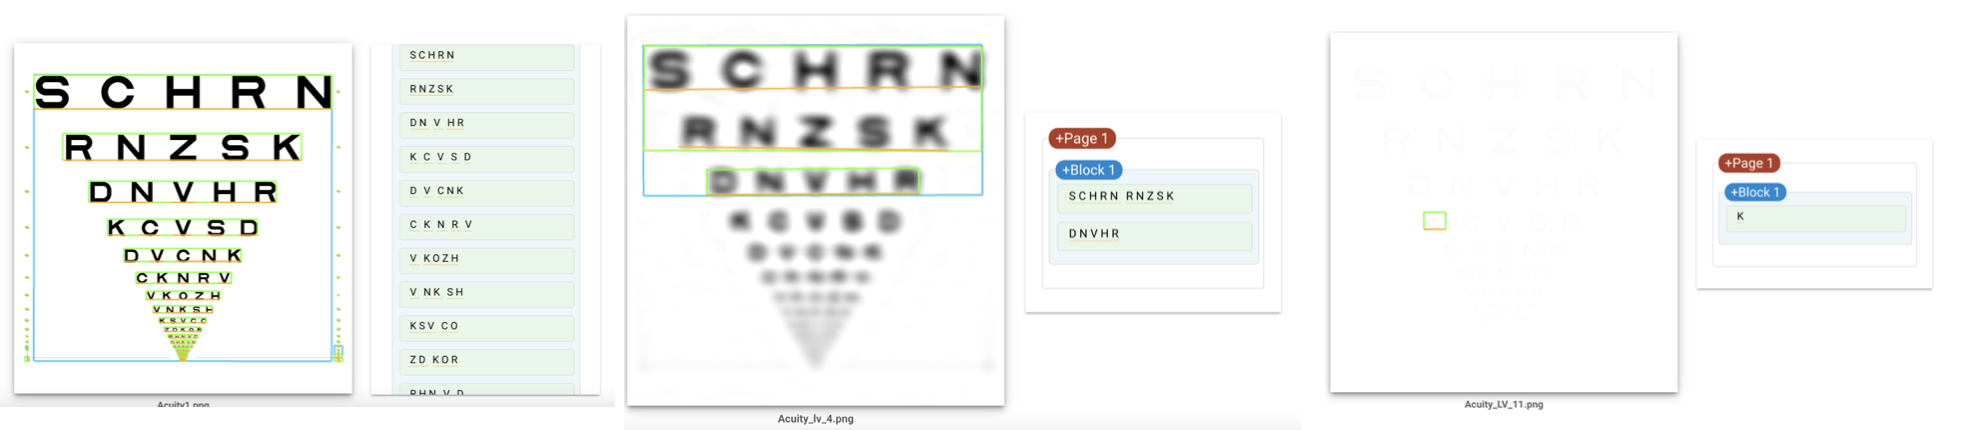
We fine-tuned and tested the SOTA object-detection and semantic segmentation models on the blurry real-world images. (green:YOLO v8, blue: SAM)
University of Minnesota designed MNREAD Acuity Charts and acuity tests to assess how reading performance depends on print size.
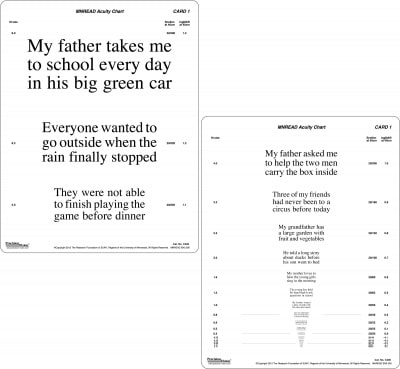
The MNREAD Acuity Charts are continuous text reading acuity charts for normal and low vision, but here we tested on letter acuity charts instead to simplify the experiment.
While all deep-learning based detections are clinging to segment as many as possible but not robust enough, the traditional OCR tool, Google Vision, shows an efficient, precise result but a low recall.
SAM on filtered images
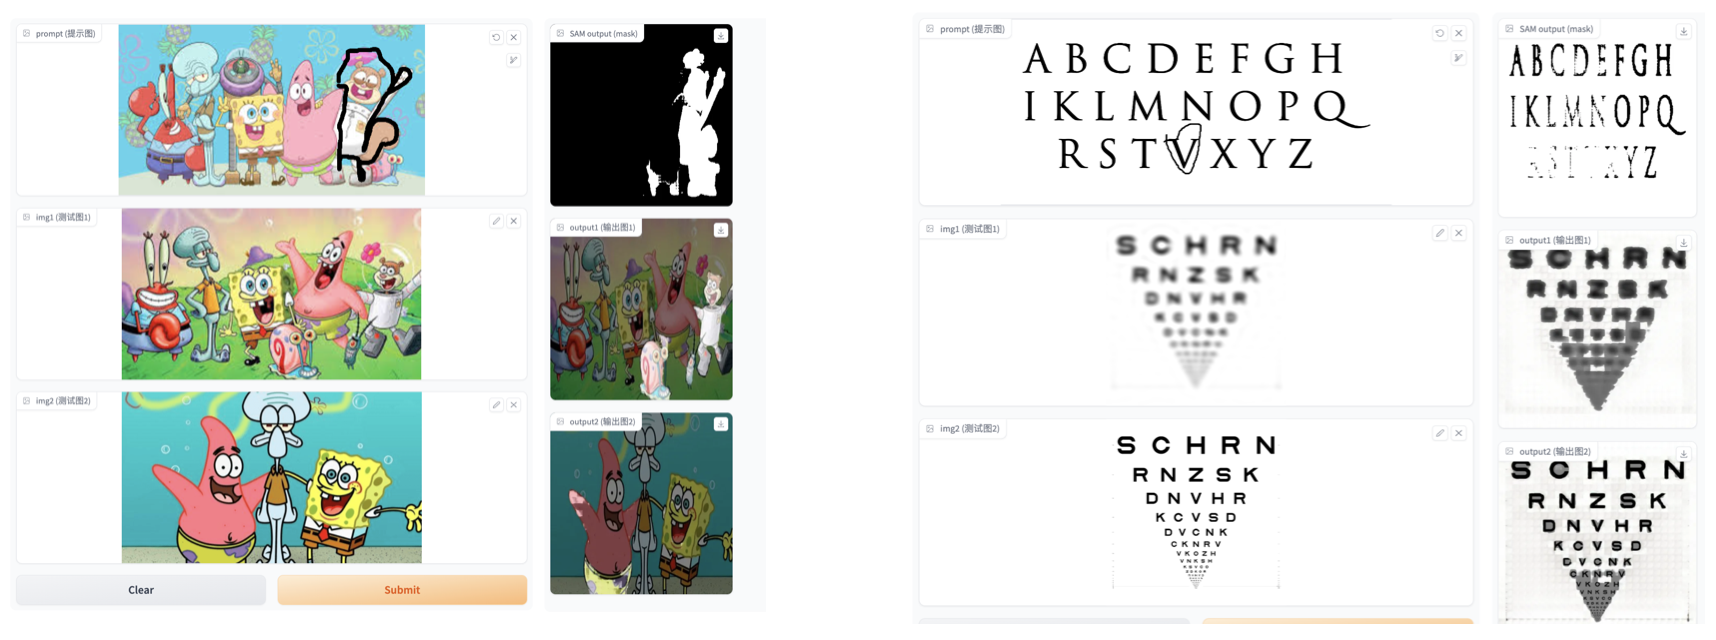
segGPT: SegGPT performs arbitrary segmentation tasks in images or videos via in-context inference, such as object instance, stuff, part, contour, and text, with only one single model.
Google Vision: vision API with powerful pre-trained machine learning models
Visual Accessibility of Smartphones
A survey[1] regarding how vision-impaired patients used their smartphones interviewed 845 people with low vision or blindness in the last 6 years. There has been a 365% increase in smartphone use within the blind community in less than five years. Specifically, in the over 65 age group smartphone use has surged from 6% to 78%, which means that further focus on accessibility and useability is required. In a word, user-led research in product and service development is highly recommended by researchers.
There are two key findings from this study. First, a significant number of people with low vision or blindness use their smartphones as a part of their everyday lives and for a broad range of purposes. Secondly, through this survey, they identified the emergence of a narrative regarding the importance of user-led research in product and service development.
Built-in Assistive Features
The majority of participants who owned a smartphone had an Apple device (74%), with 26% choosing an Android. The accessibility features of the phone were a dominant reason for their phone choice (48%). Those who used a smartphone used it throughout their everyday life − 84% cited they used it throughout the day, and for a broad range of purposes. While making and receiving calls was the most commonly cited use (97%), there was a range of uses noted. The age of the participant affected the breadth of use – there was a significant reduction in the amount of people over 65 years of age using their smartphones beyond phone calls. For example, 33% used it for emails, 24% for accessing the Web, and 17% used social media. This was a reduction of over 25% in each category compared to participants under 65.
The use of built-in assistive features was common across participants: 65% used voiceover screen reader, 43% used text resize, 41% used zoom and magnification, 32% used contrast, colour and brightness adjustments, and 18% used audio description. Voice assistants such as Siri were also popular, with 80% of participants using the program for a range of purposes.
Accessibility APPs
Beyond the smartphone, participants used a range of assistive technology: 33% used screen reading software, 34% used smart home devices, 27% used screen magnification software and 9% used bone conduction headphones. Fifty-six percent cited other assistive technology, with iPads and tablets being a dominant response, as well as computers, Apple Watch and DAISy Player. Accessibility apps were also used widely (over 50% of participants responded to our questions regarding the use of apps) and for a range of purposes. AI-based apps were the most commonly used, followed by GPS/Navigation apps, reading apps and human assistance apps. However, 13% of responses stated they had either never heard of these apps or had heard of them, but did not use them, or know how to use them.
The amount of time participants had been blind or had developed low vision impacted upon app uptake – for those with less than 5 years’ experience of their vision loss, only 29% used accessibility apps. There were also some poignant reflections from some participants on how the apps they use now (or do not use) may shift according to changing contexts – ‘I currently don’t use Apps to help me get around, but in this time of social distancing with Covid19 I anticipate a need to use something like Aira[2], a 24/7 visual interpreting service on phone, to help me follow someone into a medical consultation to avoid taking their arm and getting too close’.Issues with the apps designed for people who are blind or have low vision were most commonly cited as ‘glitches/technical issues’ (44%). Thirty eight percent expressed they were difficult to use or understand, and another 35% stated they were not fully accessible. When participants had issues with an app and found that it wasn’t accessible, most chose to delete it or not use it anymore.
Reference
[1] Locke, Kathryn, et al. “Developing accessible technologies for a changing world: understanding how people with vision impairment use smartphones.” Disability & Society 37.1 (2022): 111-128.
[2] https://aira.io/
[3] https://mnread.umn.edu/

